Past Projects

A zebrafish, widely studied for its ability to regenerate the optic nerve.1
Jan. 2021 – May 2022
Zebrafish are able to regenerate their optic nerve after an injury, while humans are not. In order to further understand how this mechanism works, I analyzed zebrafish eye angles using two different programs. I uploaded videos of adult zebrafish to DeepLabCut and labeled individual frames in order to train the neural network to recognize eye movements. I also used Stytra's built-in tracking software to follow eye movements in videos of larval zebrafish. For both adults and larval fish, I generated graphs that show how the eye angles change over time. In working on this project, I've gained experience working with neural networks and furthered my interest in machine learning algorithms.
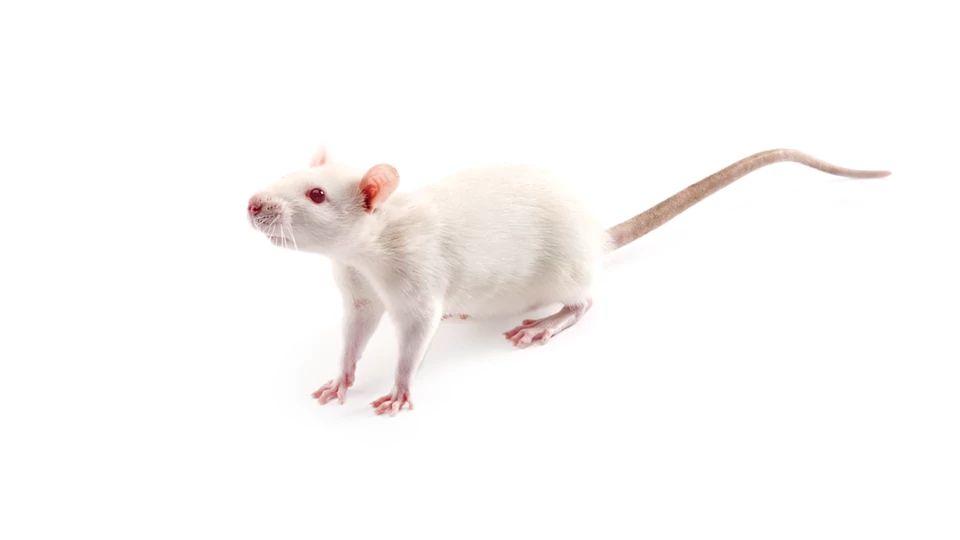
A Wistar-Kyoto rat, a model organism for behavioral inhibition.2
Mar. 2022
Wistar-Kyoto (WKY) rats are said to be behaviorally inhibited, or wary in response to unfamiliar stimuli. In order to test this hypothesis, I worked with a group of neuroscience students to measure the activity of WKY rats over a two-minute interval. We placed the rats in an open-field testing apparatus that is divided into segments, and we measured how long it took each rat to leave the starting segment, how many other segments each rat visited, and how many rearings each rat exhibited. We used Sprague-Dawley (SD) rats, a strain that is not behaviorally inhibited, as our control group. I then used SPSS to run a mathematical analysis of the data we collected and used Microsoft Excel to visualize it. Through this project, I strengthened my data visualization skills as well as my ability to communicate my conclusions effectively.
:max_bytes(150000):strip_icc():format(webp)/__opt__aboutcom__coeus__resources__content_migration__mnn__images__2019__01__ConfusedMistakenAnimalsMain-aed39c615fdf4425ab57e3216efdf119.jpg)
Sample animals used to test the sorting algorithm.3
Apr. 2021
K-means and k-means++ algorithms are used to sort similar data points by assigning them to a set number of clusters. To use these algorithms, I worked with a dataset of animals that each had a number of features, such as each animal's number of legs or whether or not it had a tail. I used these features with sklearn's k-means algorithm, built into Python, in order to create clusters and assign similar animals to each of them. I then implemented my own k-means++ algorithm, a more precise version of the k-means algorithm, to sort the same data. In writing my own algorithm, I gained a better understanding of how data are classified, from creating clusters to weighting different features of a dataset.
Click here to see the results of applying the k-means++ algorithm to the dataset.

Logo for Amazon.com Reviews.4
Mar. 2021
I worked with Amazon reviews for the Kindle Fire, using a dataset which had features such as the text of the review, the rating attached to the review, and whether or not the reviewer recommended the product. I used these reviews to construct a sentiment analysis in Python and a model that can predict whether a given review is positive or negative based on key phrases. In working on this project, I learned techniques that are used to classify data and make predictions on test data. This project also sparked my interest in machine learning and predictive algorithms.
Click here to see the results of the model.

A housing bubble, which can be modeled by linear regression.5
Feb. 2021
I created a linear regression model using a dataset of house prices in order to predict the costs of future homes. I used a dataset with data pertaining to various houses, including their prices and several features related to the houses themselves, such as the number of bedrooms and bathrooms. I wrote Python code to model the way that a home's features affect its price, which I used to predict the costs of houses based on their size. This project helped me develop my critical thinking abilities in order to make informed decisions from the analysis.
1 Javier Terriente
https://www.zeclinics.com/blog/the-zebrafish-model-a-powerful-tool-for-answering-complex-questions, accessed on July 15, 2026.
2 Charles River Laboratories
https://www.criver.com/products-services/find-model/wistar-kyoto-wky-rat?region=3611, accessed on July 15, 2026.
3 Melissa Breyer
https://www.treehugger.com/commonly-confused-animals-4869334, accessed on May 1, 2022.
4 David Currie
https://towardsdatascience.com/text-summarization-with-amazon-reviews-41801c2210b, accessed on May 1, 2022.
5 Thomas Firey
https://www.econlib.org/is-there-a-new-housing-bubble-and-what-should-be-done-about-it, accessed on May 1, 2022.